
Our Trading & Investment Courses
Explore our innovative courses focused on data-driven trading strategies to enhance your market understanding. Come to us and learn to trade Indian stock market
Course 1: Data Driven Swing StockTrading using Margin Trading Facility (MTF)
Course Title: Mastering Market Data for Profitable Swing Trading using MTF
Course Duration: 2 Days/2 hrs each day
Skill Level: Intermediate to Advanced
Prerequisites: A basic understanding of financial markets, price action, MS Excel, and access to TradingView (Essential version) or a Zerodha account and screener.in( free account)
Mode of teaching: Online (Preferred) /In-Person (Only for Bengaluru students)
Language of course: English/Hindi
Course Fees: INR 6500/-
Module 1: Introduction to Different Types of Data for MTF trading
This module will explore the fundamental differences between MTF (Margin Trading Facility) trading and traditional stock investing. We will delve into the types of data crucial for MTF trading, focusing on both fundamental (data generated by the company) and market-generated data (price, volume, relative strength, volume profile & avwap etc). Last but not least, we will try to enter the stocks only with "institutional" activity.
Company-Specific Fundamental Data: This includes financial data generated by the company under consideration, such as earnings reports, balance sheets, cash flow statements, and other qualitative factors that provide insight into a company's growth prospects & financial health.
Market-Generated Technical Data: This encompasses data generated directly from the stock market, including price movements, trading volume, and others. This data is essential for identifying trends, patterns, and potential entry/exit points for trades.
Integrating Fundamental and Technical Insights: We will introduce the "2 data point" stock quality checker, an Excel-based tool, to integrate fundamental insights with technical signals for informed MTF trading decisions. This tool helps in assessing the quality of a stock by combining financial metrics with market behaviour.
Module 2: DIFFERENT APPROACHES TO FINDING STOCKS FOR MTF TRADING: FUNDAMENTAL AND TECHNICAL INTEGRATION
This module outlines two distinct yet complementary approaches to identifying potential trading opportunities, emphasizing the synergy between fundamental and technical analysis.
Bottom-Up Approach (Fundamentally Driven, Technically Refined): This approach begins with a fundamental screening process. Stocks are initially filtered using Trade with Data's "2 data point" quality checker, which assesses their underlying financial health and quality. Subsequently, technical analysis tools are employed to determine optimal entry points and manage trades based on market dynamics.
Top-Down Approach (Technically Driven, Fundamentally Validated): This approach starts with technical indicators, specifically filtering stocks based on price breakouts around major price levels, often identified using automated Google Sheets, and significant trading volume("institutional activity"). The quality of these technically strong candidates is then rigorously checked using the "2 data point" stock quality and valuation checker, incorporating fundamental insights to validate the trading opportunity.
Module 3: Bottom-UP APPROACH (DEEP DIVING INTO FUNDAMENTAL SCREENING AND TECHNICAL ENTRY)
This module provides a detailed breakdown of the bottom-up approach, highlighting the sequential application of fundamental and technical analysis.
Fundamental Stock Screening: Begin by generating a list of potentially strong stocks using our in-house built screener, which likely incorporates various fundamental criteria (growth or Value) to identify companies exhibiting growth.
Quality Check with Fundamental & Technical Filters: Filter this list further using the "2 data point" stock quality checker. This step involves a detailed assessment of the stock's fundamental quality (e.g., profitability, debt, growth) combined with initial technical observations to ensure the stock meets specific quality benchmarks.
Technical Analysis for Entry: Once stocks are filtered for quality, technical analysis tools will be applied to determine precise entry points. This involves analyzing price charts, indicators (e.g., moving averages, volume, volume profile, relative strength etc), and chart patterns to identify the optimal price level to initiate a trade, minimizing risk and maximizing potential returns.
Institutional Activity: Enter the stocks only with institutional activity using the "TWD" proprietary built Ms-Excel sheet.
Module 4: TOP-DOWN APPROACH: FROM TECHNICAL BREAKOUTS TO FUNDAMENTAL VALIDATION
This module focuses on the top-down approach, demonstrating how to identify opportunities through technical signals and then confirm their viability with fundamental analysis.
Technical Filtering for Breakouts: Identify stocks that are exhibiting price breakouts around significant price levels, utilizing automated Google Sheets for efficient scanning of market data. This initial filter is purely technical, looking for strong momentum and clear chart patterns indicating potential upward or downward movement.
Quality and Growth Check (Fundamental Validation): After identifying technically promising stocks, their quality is rigorously checked using the "2 data point" stock quality and growth checker. This crucial step involves a fundamental assessment of the company to ensure that the technical breakout is supported by sound underlying financials and that the stock is into its growth trajectory.
Technical Analysis for Trade Execution: With both technical strength and fundamental validation confirmed, technical analysis is then used to refine the entry strategy, manage risk, and determine optimal exit points for the trade. This includes setting stop-losses and profit targets based on technical indicators and chart patterns.
Institutional Activity: Enter the stocks only with institutional activity using the "TWD" proprietary built Ms-Excel sheet.
MODULE 5: TRADER PROFILING, CHOOSING INITIAL BASKET OF STOCKS, POSITION SIZING & TRADE MANAGEMENT: BALANCING RISK AND REWARD WITH FUNDAMENTAL AND TECHNICAL CONSIDERATIONS
This module focuses on crucial aspects of risk management and trade execution, integrating the trader’s risk profile, insights from both fundamental quality and technical setups.
Strategic Position Sizing: Learn how to strategically plan the size of investment for each selected stock. This will be based not only on the technical setup (e.g., volatility, distance to stop-loss) but also significantly on the stock's fundamental quality, trade’s risk profile(for selecting initial basket of stocks).
Dynamic Trade Management: Understand how to effectively manage a trade once it has been executed. This includes setting and adjusting stop-losses and profit targets based on evolving market conditions (technical analysis) and any new fundamental information that might impact the trade's thesis. This module emphasizes continuous monitoring and adaptation to optimize trade outcomes.
Note: Students attending the course will receive MS-Excel sheets to automatically get data from the "screener.in" and an Excel sheet to filter "institutional activity" based on "volume and delivery data".
Learn the "data-driven" trading methods for profitable "swing trading". Please find the details of the course below.


Course 2: Swing Trade Derivatives (Indices) using Market Data
Learn the "data-driven" swing trading methods for profitable trading in index derivatives. Please find the details of the course below.
Course Title: Mastering Market Data for Profitable Swing Trading in Index Derivatives
Course Duration: 2-3 hrs
Skill Level: Intermediate to Advanced
Prerequisites: Basic understanding of financial markets, price action, MS-Excel, and access to Trading View (Essential version)
Mode of teaching (only on weekends): Online(Preferred) /In-Person (Only for Bengaluru students)
Language of course: English/Hindi
Course Fees: INR 5500/-
Module 1: Introduction to Market Data & Its Role in Trading
Understanding the importance of data in trading and how it adds value
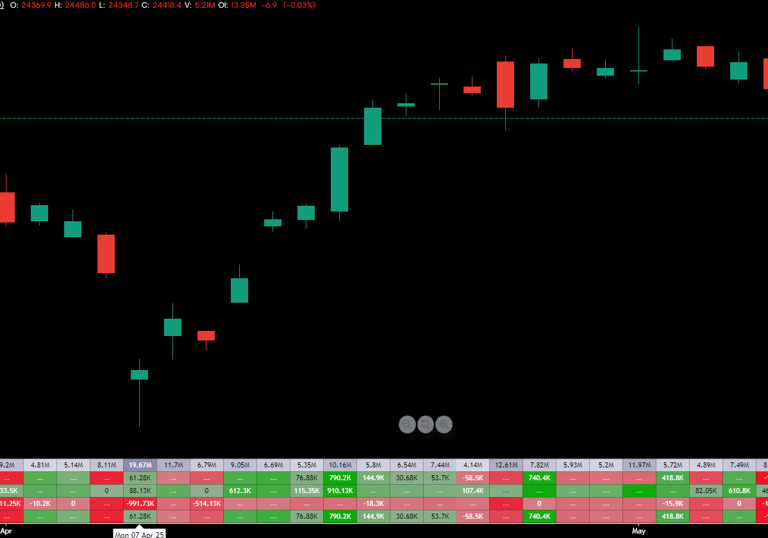
Types of market-generated data (Volume-Delta, Open Interest, Price Action )
Module 2: Volume Delta & Market Sentiment
What is volume-Delta & why does it matter
Volume Delta spikes & market reversals
Module 3: Open Interest & Market Sentiment
What is Open Interest, and why is it the most important data to gauge the sentiment
How to track the sentiment of FII's, DII's and Pro traders (institutions) using "Futures" Open Interest
How to combine Volume Delta & Open Interest to find market context
Module 4: Combining the above tools to create "the strategy"
How to combine the above-mentioned tools to create the "swing trading strategy".
Module 5: Instruments to Swing Trade (Futures or Options) & Basics of Risk Management
Note: Students attending the course will receive MS-Excel sheets with TWD's logic to filter FII's & Pro Traders' positions to gauge the Index(Nifty) sentiments
Connect
Empowering traders through data-driven education.
Contact US:
info.tradewithdata@gmail.com
WhatsApp/Call: 9177707768
© 2025. All rights reserved.